Image segmentation is a fundamental step in several image processing tasks. It is a process where an image is divided into its constituent regions guided by a similarity criterion. One very interesting image segmentation method is the Color Structure Code (CSC), which combines simultaneously split-and-merge and region-growing techniques. In this paper a segmentation approach based on the CSC method, Weighted Color Structure Code (WCSC), is proposed. This method is guided by a non-linear discrimination function, where the user-inference is captured by the Polynomial Mahalanobis, prioritizing, during the merging process, the regions with higher similarity to the user selected pattern. The WCSC has color distribution pattern-oriented characteristic, showing better coherence among the segments with higher similarity to the selected pattern. A qualitative evaluation and parametric paired analysis were performed to compare CSC, WCSC and other segmentation methods results, using images from Berkeley benchmark. The results from these comparison indicate an improvement on the segmentation result obtained by the WCSC.
First Experiment
The perform experiment was the comparison, first visual than quantitative of the results for both methods.
Segmentation Results obtained using 60 images from Berkeley Dataset:
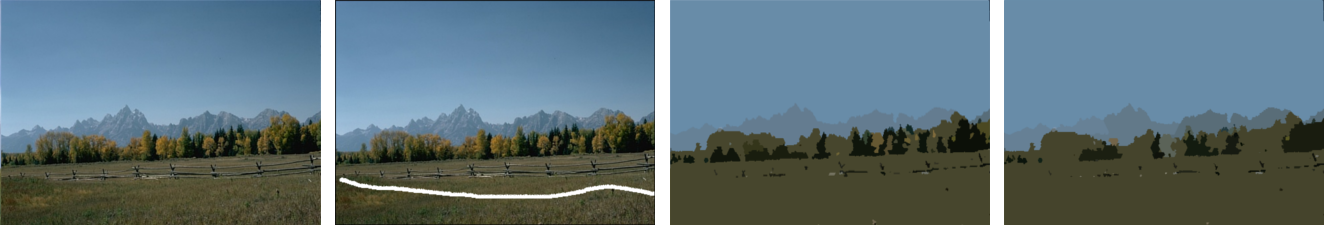
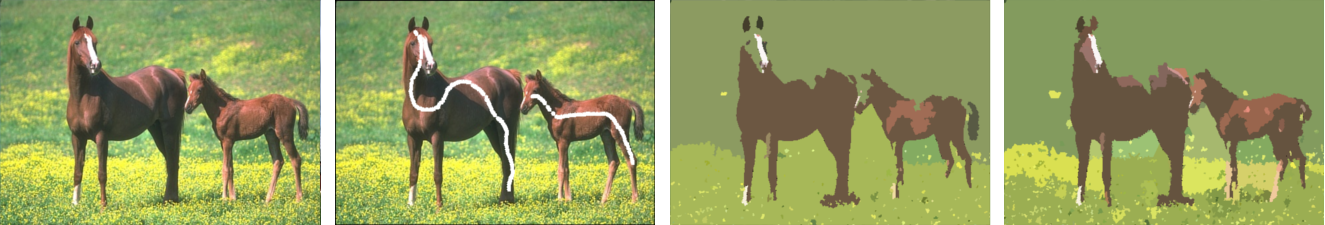
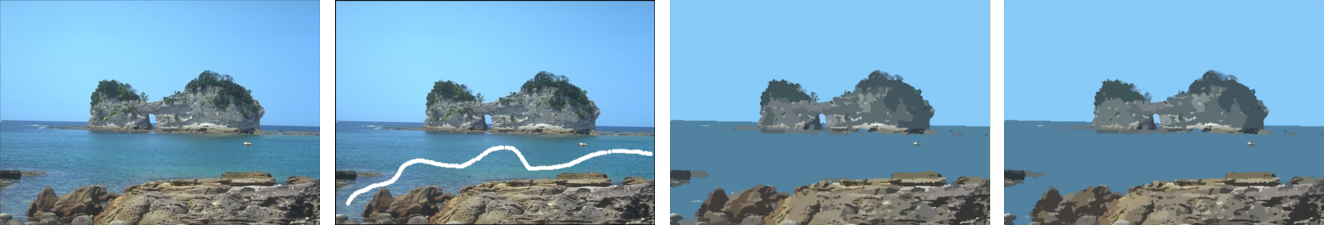
Comparison between CSC and WCSC segmentation results for image 2092. (A) original image, (B) white line showing the selected pattern on the image (C) CSC, (D) WCSC.

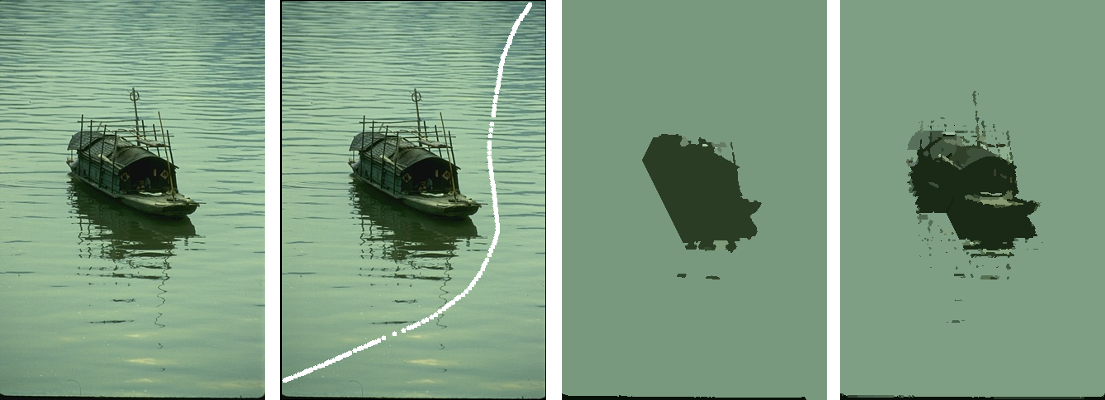
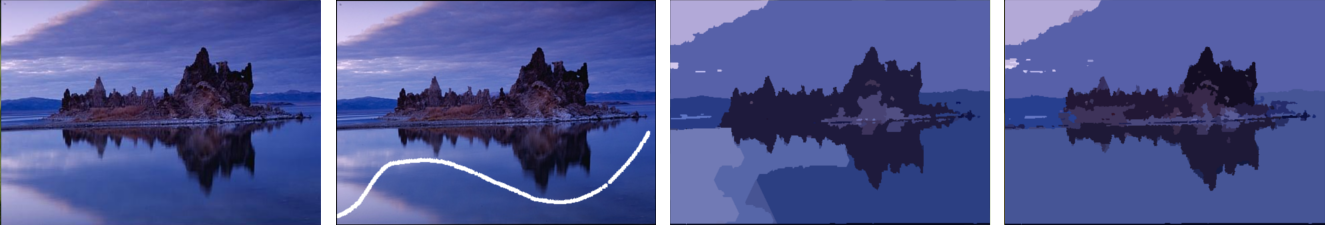
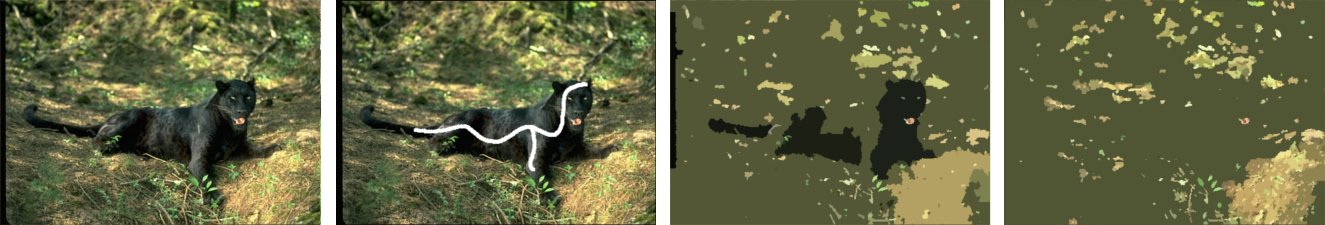
Comparison between CSC and WCSC segmentation results for image 3096. (A) original image, (B) white line showing the selected pattern on the image (C) CSC, (D) WCSC.

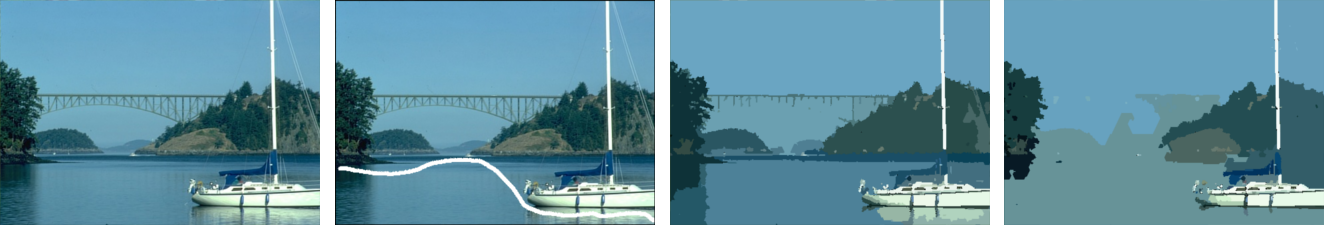
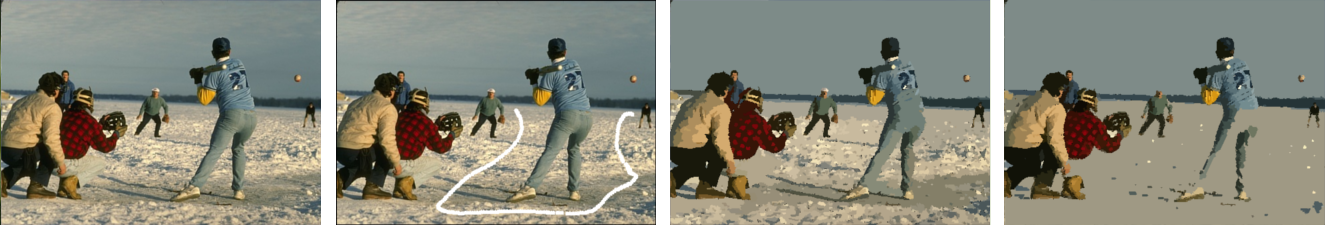
Comparison between CSC and WCSC segmentation results for image 12003. (A) original image, (B) white line showing the selected pattern on the image (C) CSC, (D) WCSC.
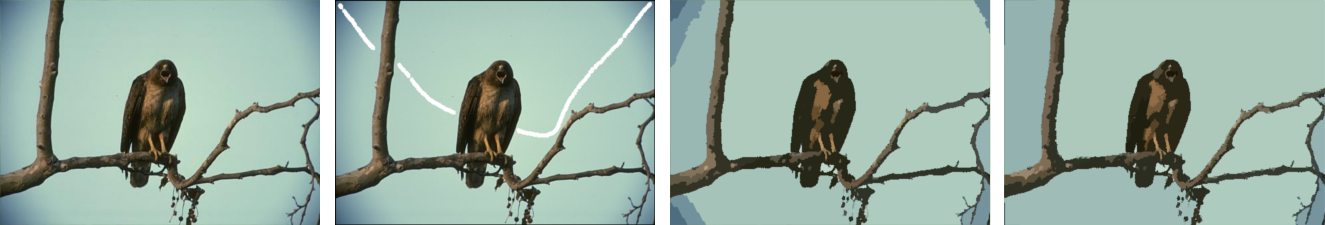
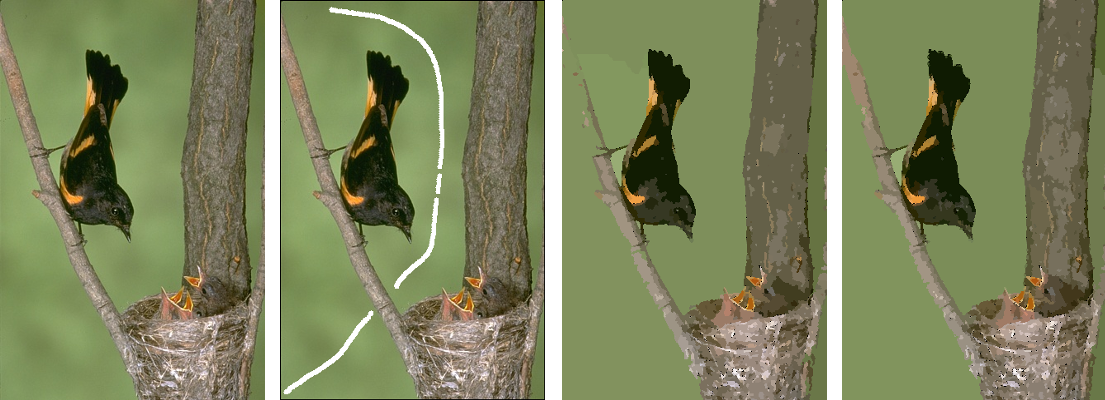
Comparison between CSC and WCSC segmentation results for image 15088. (A) original image, (B) white line showing the selected pattern on the image (C) CSC, (D) WCSC.

Comparison between CSC and WCSC segmentation results for image 16052. (A) original image, (B) white line showing the selected pattern on the image (C) CSC, (D) WCSC.
Comparison between CSC and WCSC segmentation results for image 22090. (A) original image, (B) white line showing the selected pattern on the image (C) CSC, (D) WCSC.

Comparison between CSC and WCSC segmentation results for image 24004. (A) original image, (B) white line showing the selected pattern on the image (C) CSC, (D) WCSC.

Comparison between CSC and WCSC segmentation results for image 24063. (A) original image, (B) white line showing the selected pattern on the image (C) CSC, (D) WCSC.

Comparison between CSC and WCSC segmentation results for image 35070. (A) original image, (B) white line showing the selected pattern on the image (C) CSC, (D) WCSC.
Comparison between CSC and WCSC segmentation results for image 42049. (A) original image, (B) white line showing the selected pattern on the image (C) CSC, (D) WCSC.

Comparison between CSC and WCSC segmentation results for image 46076. (A) original image, (B) white line showing the selected pattern on the image (C) CSC, (D) WCSC.

Comparison between CSC and WCSC segmentation results for image 48055. (A) original image, (B) white line showing the selected pattern on the image (C) CSC, (D) WCSC.

Comparison between CSC and WCSC segmentation results for image 60079. (A) original image, (B) white line showing the selected pattern on the image (C) CSC, (D) WCSC.

Comparison between CSC and WCSC segmentation results for image 61060. (A) original image, (B) white line showing the selected pattern on the image (C) CSC, (D) WCSC.

Comparison between CSC and WCSC segmentation results for image 62096. (A) original image, (B) white line showing the selected pattern on the image (C) CSC, (D) WCSC.

Comparison between CSC and WCSC segmentation results for image 66075. (A) original image, (B) white line showing the selected pattern on the image (C) CSC, (D) WCSC.

Comparison between CSC and WCSC segmentation results for image 67079. (A) original image, (B) white line showing the selected pattern on the image (C) CSC, (D) WCSC.

Comparison between CSC and WCSC segmentation results for image 68077. (A) original image, (B) white line showing the selected pattern on the image (C) CSC, (D) WCSC.

Comparison between CSC and WCSC segmentation results for image 69015. (A) original image, (B) white line showing the selected pattern on the image (C) CSC, (D) WCSC.

Comparison between CSC and WCSC segmentation results for image 80099. (A) original image, (B) white line showing the selected pattern on the image (C) CSC, (D) WCSC.

Comparison between CSC and WCSC segmentation results for image 94079. (A) original image, (B) white line showing the selected pattern on the image (C) CSC, (D) WCSC.

Comparison between CSC and WCSC segmentation results for image 97017. (A) original image, (B) white line showing the selected pattern on the image (C) CSC, (D) WCSC.

Comparison between CSC and WCSC segmentation results for image 97033. (A) original image, (B) white line showing the selected pattern on the image (C) CSC, (D) WCSC.

Comparison between CSC and WCSC segmentation results for image 100075. (A) original image, (B) white line showing the selected pattern on the image (C) CSC, (D) WCSC.

Comparison between CSC and WCSC segmentation results for image 100080. (A) original image, (B) white line showing the selected pattern on the image (C) CSC, (D) WCSC.

Comparison between CSC and WCSC segmentation results for image 113009. (A) original image, (B) white line showing the selected pattern on the image (C) CSC, (D) WCSC.
Comparison between CSC and WCSC segmentation results for image 113016. (A) original image, (B) white line showing the selected pattern on the image (C) CSC, (D) WCSC.

Comparison between CSC and WCSC segmentation results for image 113044. (A) original image, (B) white line showing the selected pattern on the image (C) CSC, (D) WCSC.

Comparison between CSC and WCSC segmentation results for image 118035. (A) original image, (B) white line showing the selected pattern on the image (C) CSC, (D) WCSC.

Comparison between CSC and WCSC segmentation results for image 124084. (A) original image, (B) white line showing the selected pattern on the image (C) CSC, (D) WCSC.

Comparison between CSC and WCSC segmentation results for image 126007. (A) original image, (B) white line showing the selected pattern on the image (C) CSC, (D) WCSC.

Comparison between CSC and WCSC segmentation results for image 135069. (A) original image, (B) white line showing the selected pattern on the image (C) CSC, (D) WCSC.
Comparison between CSC and WCSC segmentation results for image 143090. (A) original image, (B) white line showing the selected pattern on the image (C) CSC, (D) WCSC.
Comparison between CSC and WCSC segmentation results for image 151087. (A) original image, (B) white line showing the selected pattern on the image (C) CSC, (D) WCSC.

Comparison between CSC and WCSC segmentation results for image 159091. (A) original image, (B) white line showing the selected pattern on the image (C) CSC, (D) WCSC.

Comparison between CSC and WCSC segmentation results for image 161062. (A) original image, (B) white line showing the selected pattern on the image (C) CSC, (D) WCSC.
Comparison between CSC and WCSC segmentation results for image 163014. (A) original image, (B) white line showing the selected pattern on the image (C) CSC, (D) WCSC.

Comparison between CSC and WCSC segmentation results for image 167062. (A) original image, (B) white line showing the selected pattern on the image (C) CSC, (D) WCSC.

Comparison between CSC and WCSC segmentation results for image 167083. (A) original image, (B) white line showing the selected pattern on the image (C) CSC, (D) WCSC.

Comparison between CSC and WCSC segmentation results for image 183055. (A) original image, (B) white line showing the selected pattern on the image (C) CSC, (D) WCSC.

Comparison between CSC and WCSC segmentation results for image 196073. (A) original image, (B) white line showing the selected pattern on the image (C) CSC, (D) WCSC.

Comparison between CSC and WCSC segmentation results for image 207056. (A) original image, (B) white line showing the selected pattern on the image (C) CSC, (D) WCSC.

Comparison between CSC and WCSC segmentation results for image 208001. (A) original image, (B) white line showing the selected pattern on the image (C) CSC, (D) WCSC.

Comparison between CSC and WCSC segmentation results for image 216053. (A) original image, (B) white line showing the selected pattern on the image (C) CSC, (D) WCSC.

Comparison between CSC and WCSC segmentation results for image 225017. (A) original image, (B) white line showing the selected pattern on the image (C) CSC, (D) WCSC.

Comparison between CSC and WCSC segmentation results for image 227092. (A) original image, (B) white line showing the selected pattern on the image (C) CSC, (D) WCSC.

Comparison between CSC and WCSC segmentation results for image 238011. (A) original image, (B) white line showing the selected pattern on the image (C) CSC, (D) WCSC.

Comparison between CSC and WCSC segmentation results for image 247085. (A) original image, (B) white line showing the selected pattern on the image (C) CSC, (D) WCSC.
Comparison between CSC and WCSC segmentation results for image 249061. (A) original image, (B) white line showing the selected pattern on the image (C) CSC, (D) WCSC.

Comparison between CSC and WCSC segmentation results for image 253036. (A) original image, (B) white line showing the selected pattern on the image (C) CSC, (D) WCSC.

Comparison between CSC and WCSC segmentation results for image 260058. (A) original image, (B) white line showing the selected pattern on the image (C) CSC, (D) WCSC.

Comparison between CSC and WCSC segmentation results for image 291000. (A) original image, (B) white line showing the selected pattern on the image (C) CSC, (D) WCSC.

Comparison between CSC and WCSC segmentation results for image 295087. (A) original image, (B) white line showing the selected pattern on the image (C) CSC, (D) WCSC.

Comparison between CSC and WCSC segmentation results for image 299091. (A) original image, (B) white line showing the selected pattern on the image (C) CSC, (D) WCSC.

Comparison between CSC and WCSC segmentation results for image 300091. (A) original image, (B) white line showing the selected pattern on the image (C) CSC, (D) WCSC.
Comparison between CSC and WCSC segmentation results for image 304034. (A) original image, (B) white line showing the selected pattern on the image (C) CSC, (D) WCSC.

Comparison between CSC and WCSC segmentation results for image 310007. (A) original image, (B) white line showing the selected pattern on the image (C) CSC, (D) WCSC.

Comparison between CSC and WCSC segmentation results for image 368078. (A) original image, (B) white line showing the selected pattern on the image (C) CSC, (D) WCSC.

Comparison between CSC and WCSC segmentation results for image 374067. (A) original image, (B) white line showing the selected pattern on the image (C) CSC, (D) WCSC.

Comparison between CSC and WCSC segmentation results for image 388016. (A) original image, (B) white line showing the selected pattern on the image (C) CSC, (D) WCSC.
Table below shows the values of Rand index for each of the 60 images, used for validation and quantitative analysis:

Table comparing the Rand index results between CSC and WCSC for all the 60 selected images. The column image is the reference number of the image on the Berkeley dataset.
Statistical comparison between the values of Rand index for the two approaches:

Comparison of CSC and WCSC performance. (a) box-plot comparing CSC and WCSC Rand index dissimilarity to GT results. (b) paired comparison image sequence related to GT.
Second Experiment
The second experiment uses the results obtained previously for both methods (CSC and WCSC) and compares with other segmentation algorithms (Edge Detection and Image Segmentation (EDISON), Mumford-Shah (MS), Watershed (WS), JSEG, Recursive Hierarchical Segmentation (RHSEG)). Figure below shows the comparison between segmentation results for all the algorithms used and the graph result from Rand index value for each method.
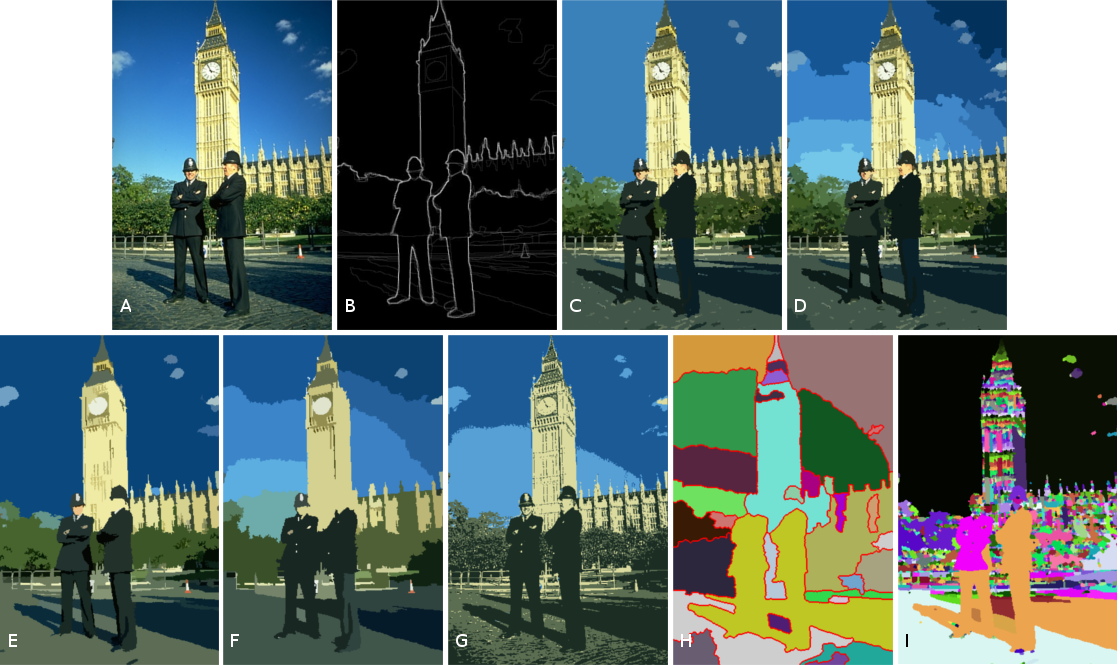
Comparison between segmentation methods on image 368068. (A) original image, (B)
Ground Truth, (C) WCSC, (D) CSC, (E) Edison, (F) Munford-Shah, (G) RHSEG, (H) JSEG and
(I) Watershed.

Graph showing the Rand index score for the image 368068 for each method tested.
To summarize the comparison between methods, we show in Figure below the boxplot of the Rand index obtained for 16 images with each tested method and the values of Rand index used to build the boxplot. This plot shows that WCSC has the lowest mean value, indicating that among the 16 images, the proposed approach, according to the validation method, obtained an improvement on the segmentation results.

Graph showing the boxplot of Rand index for 16 images for each method tested.
More information can be found on the published article.