The computational analysis applicability of paleontological images ranges from the study of animals, plants and microorganisms evolution to the simulations of the habitat that such specimens lived. It also can be applied in several niches, such as oil exploration, where there are several factors to be analyzed in order to reduce the expenses related to the oil extraction process. One factor is the environment to be explored characterization, which can occur in several ways: use of probes, extraction of samples for petrophysical components evaluation, the correlation with logs of other drilling wells and so on. In the samples extraction part the Computed Tomography (CT) is of importance because it preserves the sample and makes it available for several analyzes. Based on the CT generated images, several analyzes and simulations performed and processes, performed manually and exhaustively, automated.
After an initial analysis about methods generally employed into the fossils area, and the difficulty to find works that explore microfossils, we generalized our search for methods in other similar areas. We started by performing a systematic literature review on 3D segmentation methods applied to tomographic images, 3d segmentation algorithms for computerized tomographic imaging: a systematic literature review. Several works were analyzed which comprehended a vast group of segmentation methods. In our review, we noticed a tendency on the use of 3D segmentation methods based on models and region growing. However, its use for fossil/microfossil segmentation wasn’t noticed in the literature.
We also analysed the 3D object recognition field using the same systematic literature review methodology previously employed, 3d object recognition and classification: a systematic literature review. In our literature review we could identify two general pipelines . Both pipelines start with the data acquisition, which can basically vary between MRI, CT and RGB and RGBD cameras, pre-processing, where methods for artifact removal, image enhancement and image simplification are included and data representation, wherein several authors proposed a huge amount of different object representations. Then, it comes the stage where both pipelines differ: In the first pipeline, the data representation stage is used for describe and storage the object representation chosen, which is posterior use for similarity calculation and object identification; In the second pipeline, the data representation is employed for training a specific recognition architecture, such as a neural network, which is after used for other objects recognition. Despite having found two general approaches for 3D object recognition, we could not identify, in our review, the application of these approaches on fossil identification.
Therefore, in our work, we explore the methods applied for 3D segmentation and object identification aiming the microfossil recognition.
Contents
Application Scenario
Let’s imagine the following scenario: A paleontologist receives a rock sample with microfossils for analysis. The time needed for the complete process of microfossils isolation, performed manually, is high and after this process the rock sample is destroyed. After this, the paleontologist will analyse the microfossil physical isolation result and classify manually each isolated microfossil based on specific features. Lastly, a report will be generated with the microfossils found into the rock sample analyzed. Now let’s hypothesize that the company where this paleontologist works acquired a tomographic image analysis software, specific for microfossil analysis. This software performs the microfossil identification and extraction from the rock sample automatically with minimal or no supervision at all. In this way the paleontologist can load his tomographic sample, select the specific pipeline and leave the procedure executed during the night, leaving to the paleontologist the work of evaluating the obtained extraction results, that previously required a predominantly manual effort, and classify each extracted microfossil. In the following picture it is shown the substitution from the manual process to a full digital sequence performed in the program planned for rock analysis.
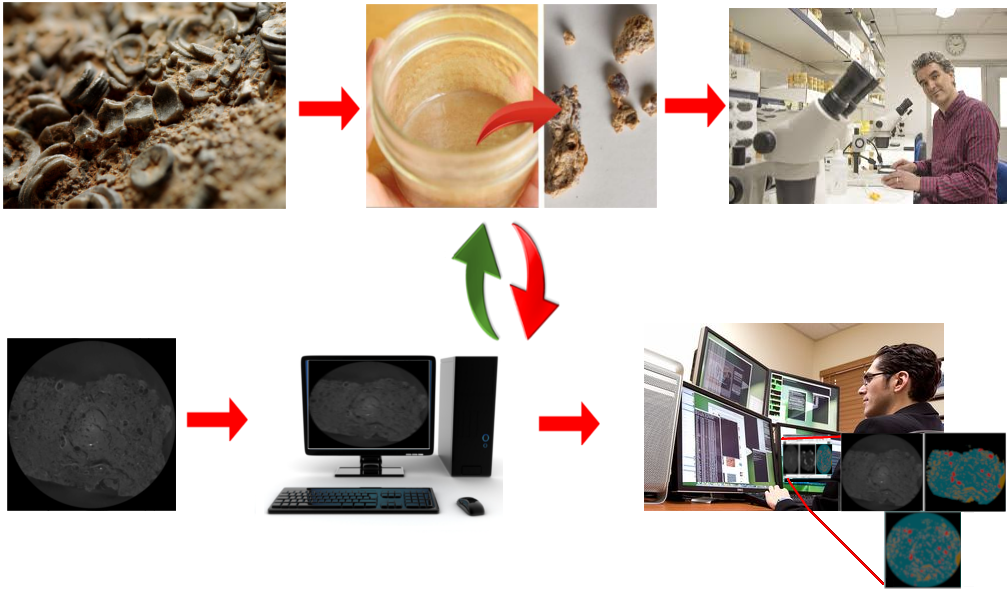
Substitution from the manual process to a full digital sequence
Database
Due to the fact that we didn’t find, in the literature, a public available dataset, we construct our own dataset. The samples employed in the dataset were obtained from specialists in paleontology and, to digitalize those samples, the following micro-CT was used: Versa XRM-500, best resolution with 0.7 mu, voltage 30-160 kV, potency 2-10 W, CCD cameras 2048×2048 pixel, lenses 0.4X, 4X, 10X, 20X and 40X, maximum mass capacity 15 kg and sample size limit (diameter / height) 80/300 mm. The samples acquisition parameters employed were: Resolution 1.08 mm (image pixel size), image size 956x1004x983, no filtering for beam correction hardening, 10x optical lens, 30 kV / 2W, angular pitch 0.255\degree and exposure time 11 seconds.

Digitalized rock sample
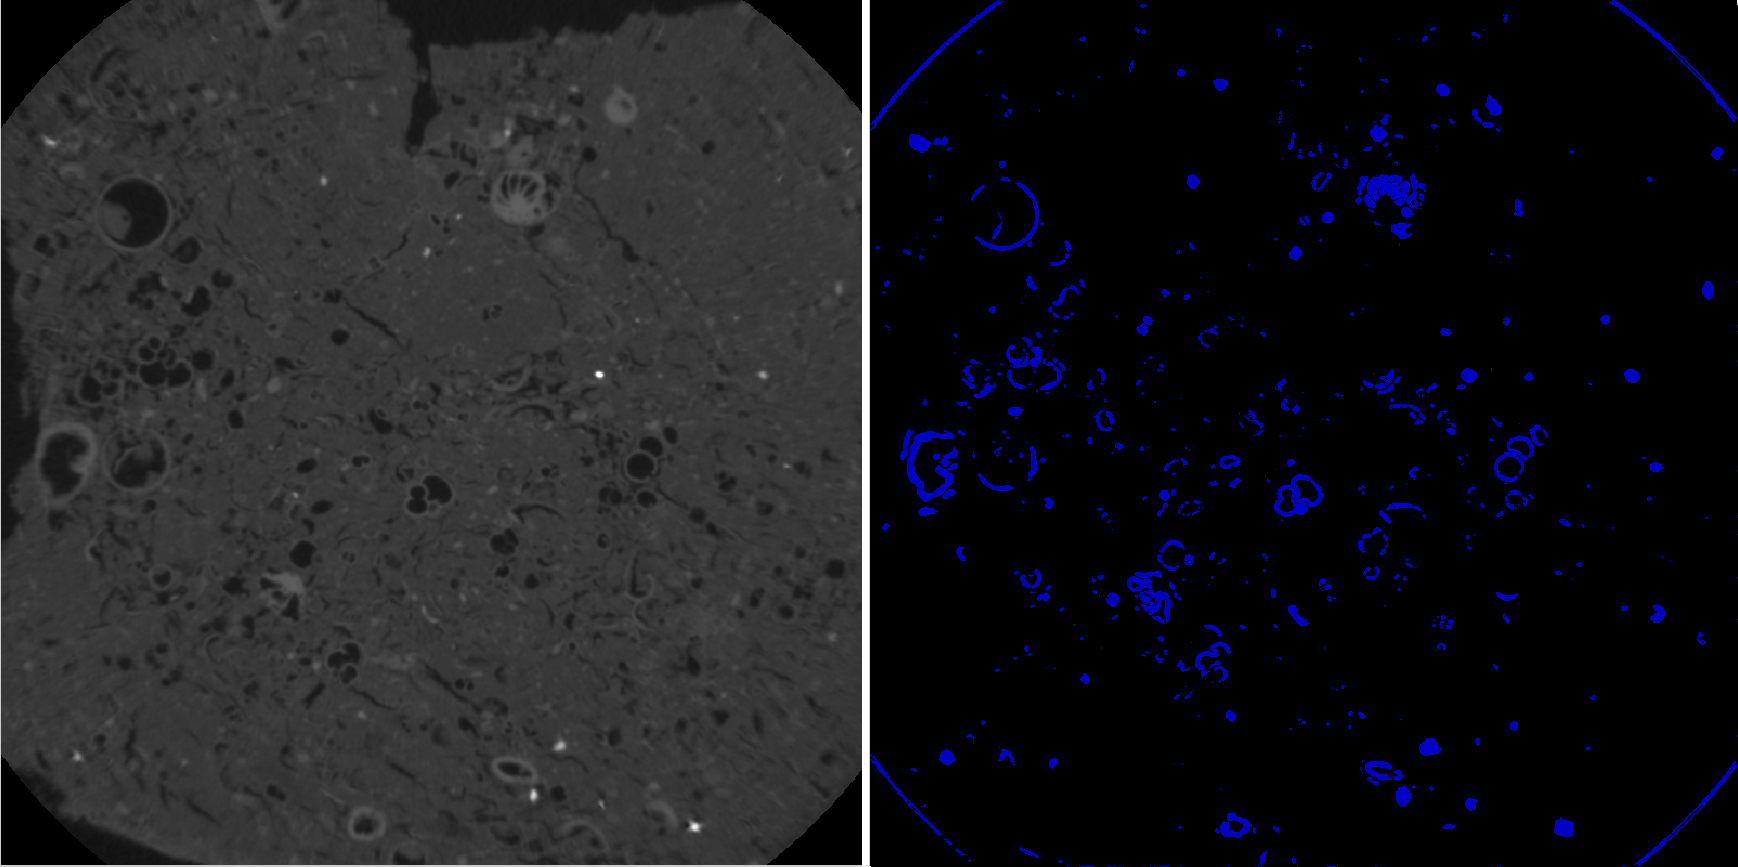
With the samples virtual model, we requested to the paleontologists to manually mark the microfossils in each volume slice. These manual annotations is generally referred as Ground Truth (GT), the figure bellow shows the GT from one volume slice. We made available for download the 3 GTs for the same sample produced by 3 different paleontology specialists. We also attached the full volume employed in our experiments.

Original image and its GT overlapping the image
Experiments
As the segmentation step has a direct influence in the microfossil identification quality, the experiments with such methods were extensive, searching for the best segmentation algorithm with the most appropriate input parameters. We performed tests with some classical segmentation algorithms such as: active contours, simple threshold and threshold with OTSU all taking into account the complete tomographic volume. Even with the use of genetic algorithms to find the best input parameters, we obtained a low evaluation score (20 % of Intersection Over Union).
Original image and the result using Active contours
Due to the fact that segmentation is crucial for a good microfossil recognition, and the current machine learning improvements, we decided to move from classical computer vision methods and test deep learning models employed into the image understating area. More specifically, we explored deep learning applied to semantic segmentation, which can basically be summarized by three principal factors: Model, database and loss function.
The model refers to the employed network architecture (depth and operations). The database refers to data quantity and quality and, in the semantic segmentation case, image annotation quality (ground truth). The last factor is the loss function. Due to the fact that the training for a deep learning model uses stochastic gradient descent, it is required that you choose a loss function when constructing your model. There are several books explaining all the concepts related to deep learning, but here we decided to show something more practical.
With the initial structure described, our first experiment used only the microfossil annotation, performing a binary classification between microfossil and the everything else classes. To implement our initial model, and all the subsequent improvements, we employed the fastai framework, which is basically a layer over pytorch with Good practices in deep learning.
To improve our obtained initial results some strategies such as data augmentation and transfer learning were applied aiming to minimize the effect of having a small database. However, the obtained Intersection over Union (IoU) metric stopped in 40-45 %. Trying to improve the obtained results, we increased the number of classes to four, which divided the everything else class into porous space, rock and background. With this number of classes, the obtained IoU value went from 40-45 % to 75-76 % and stopped. One problem with this approach is the data balance, i.e., the existence, in the samples, of more annotations from one class in comparison with another. In our case, the existence of more pixels classified as rock annotations than microfossil annotations. The figure bellow shows the result obtained after marking and training for the 4 classes setup for a selected slice.
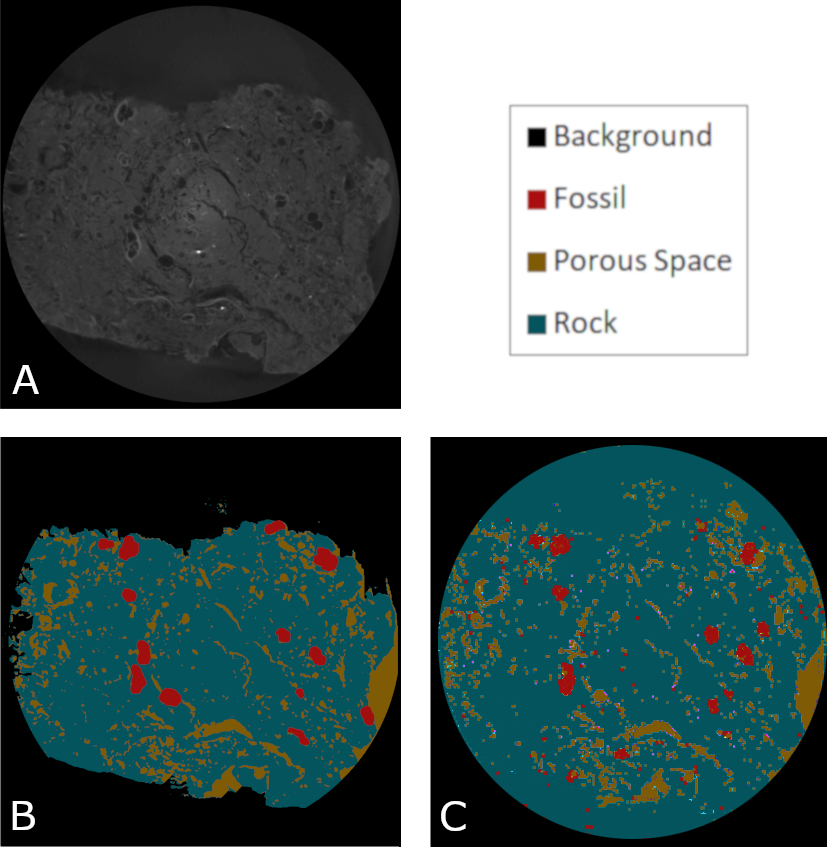
Obtained microfossil segmentation results with the 4-classes approach. (A) Original digitalised image. (B) Ground Truth manually generated by paleontologists. (C) UNET + ResNet34.
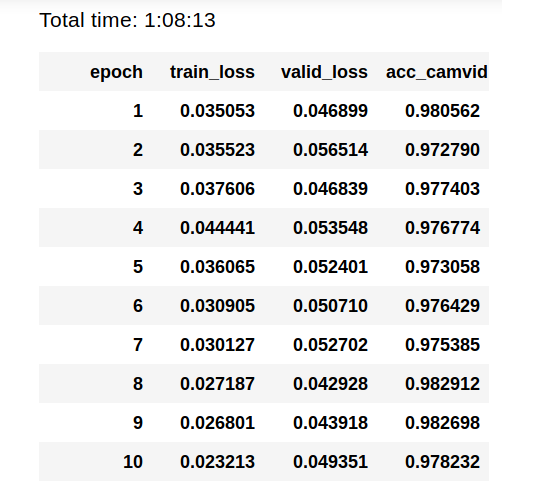
Still using the same structure with some adjustments such as increasing the batch size, resizing to train with smaller image resolution, finding the best learning rate and some updates with the fastai framework we obtained an improvement in our results and consequently in our IOU score. Both IOU and the last obtained result are show bellow.
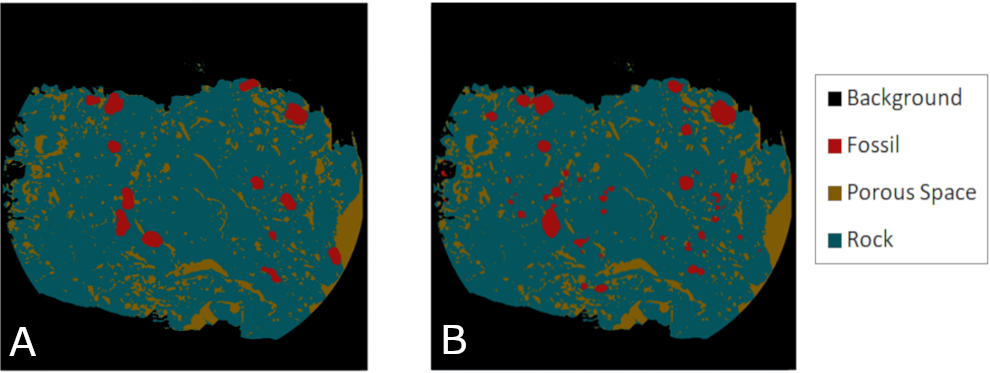
The ground truth (A) and the obtained microfossil segmentation result (B) with 4 classes, automated hyper-parameters search and additional data augmentation.
The Jupyter Notebook employed to generate our results is available in the following repos:
- Institutional Git: https://codigos.ufsc.br/lapix/Segmentation-of-Microfossils-in-Carbonatic-Rocks
- Author’s private Git: https://github.com/awangenh/Segmentation-of-Microfossils-in-Carbonatic-Rocks
Refer to the jupyter notebook installation guide or import the file with Google Colaboratory to visualize the code.
Although we obtained a value of 98% of IOU, we can notice that analyzing specifically the microfossil segmentation, there is still room for improvement. This is because despite the high IOU value, the IOU is taking into account all the classes, thus this value is taking in consideration the rock, the pore space and background pixels. To have a more accurate result two things have to be solved: The first is the data balance, i.e., too many rock and pore space pixels compared with the number of microfossils pixels; The second is how we calculate our IOU score, i.e., the microfossils segmentation should have more weight in the final score value.
Related Publications
-
Automated Microfossil Identification and Segmentation Using a Deep Learning Approach.

- Veja também no nosso tutorial Artificial Intelligence & Paleontology: Use Deep Learning to search for Microfossils no TowardsDataScience: https://towardsdatascience.com/artificial-intelligence-paleontology-use-deep-learning-to-search-for-microfossils-18760bb30880
- 3D object recognition and classification: a systematic literature review. CARVALHO, L. E. ; VON WANGENHEIM, A. PATTERN ANALYSIS AND APPLICATIONS, v. First, p. 1-50, 2019. DOI: http://dx.doi.org/10.1007/s10044-019-00804-4
- Literature Review for 3D Object Classification/Recognition. CARVALHO, L.E.; VON WANGENHEIM, A. Florianopolis: Relatórios Técnicos do INCoD, INCoD/LAPIX.29.2017.E.01. [PDF] [DOI: 10.13140/RG.2.2.12899.25127]
- Revisão da literatura para algoritmos de segmentação 3D aplicados a imagens tomográficas. CARVALHO, L.E.; VON WANGENHEIM, A. Florianopolis: Relatórios Técnicos do INCoD, INCoD/LAPIX.28.2017.E.01. [PDF] [DOI: 10.13140/RG.2.2.33596.54407]
Citing this Dataset
@article {MicrofossilSegmentation2020,
   title = "Automated Microfossil Identification and Segmentation using a Deep Learning Approach",
   journal = "Marine Micropaleontology",
   volume = "158",
   pages = "101890",
   year = "2020",
   issn = "0377-8398",
   doi = "https://doi.org/10.1016/j.marmicro.2020.101890" onclick="return TrackClick('https%3A%2F%2Fdoi.org%2F10.1016%2Fj.marmicro.2020.101890','https%3A%2F%2Fdoi.org%2F10.1016%2Fj.marmicro.2020.101890')",
   url = "http://www.sciencedirect.com/science/article/pii/S0377839819300830",
   author = "L.E. Carvalho and G. Fauth and S. {Baecker Fauth} and G. Krahl and A.C. Moreira and C.P. Fernandes and A. {von Wangenheim}",
   keywords = "3D image Segmentation, Paleontology, Microfossil, Semantic Segmentation, Deep Learning",
}